Human vs Mouse vs Fly: How We Measured Five Rounds of Brain-Cell Comparisons (and What We Got Wrong First)
We compared human, mouse and fruit-fly neurons in five rounds using three public connectomes. This post lists every number, how it was measured, the seven mistakes we caught before publishing, and why the comparison is not a fair fight.
This is the methods post behind our video Human vs mouse vs fruit fly brain cells: who wins?. The video is four minutes long. This post has the numbers, how each was measured, and the corrections.
한국어판: 사람 vs 쥐 vs 파리: 뇌세포 다섯 라운드를 어떻게 쟀나
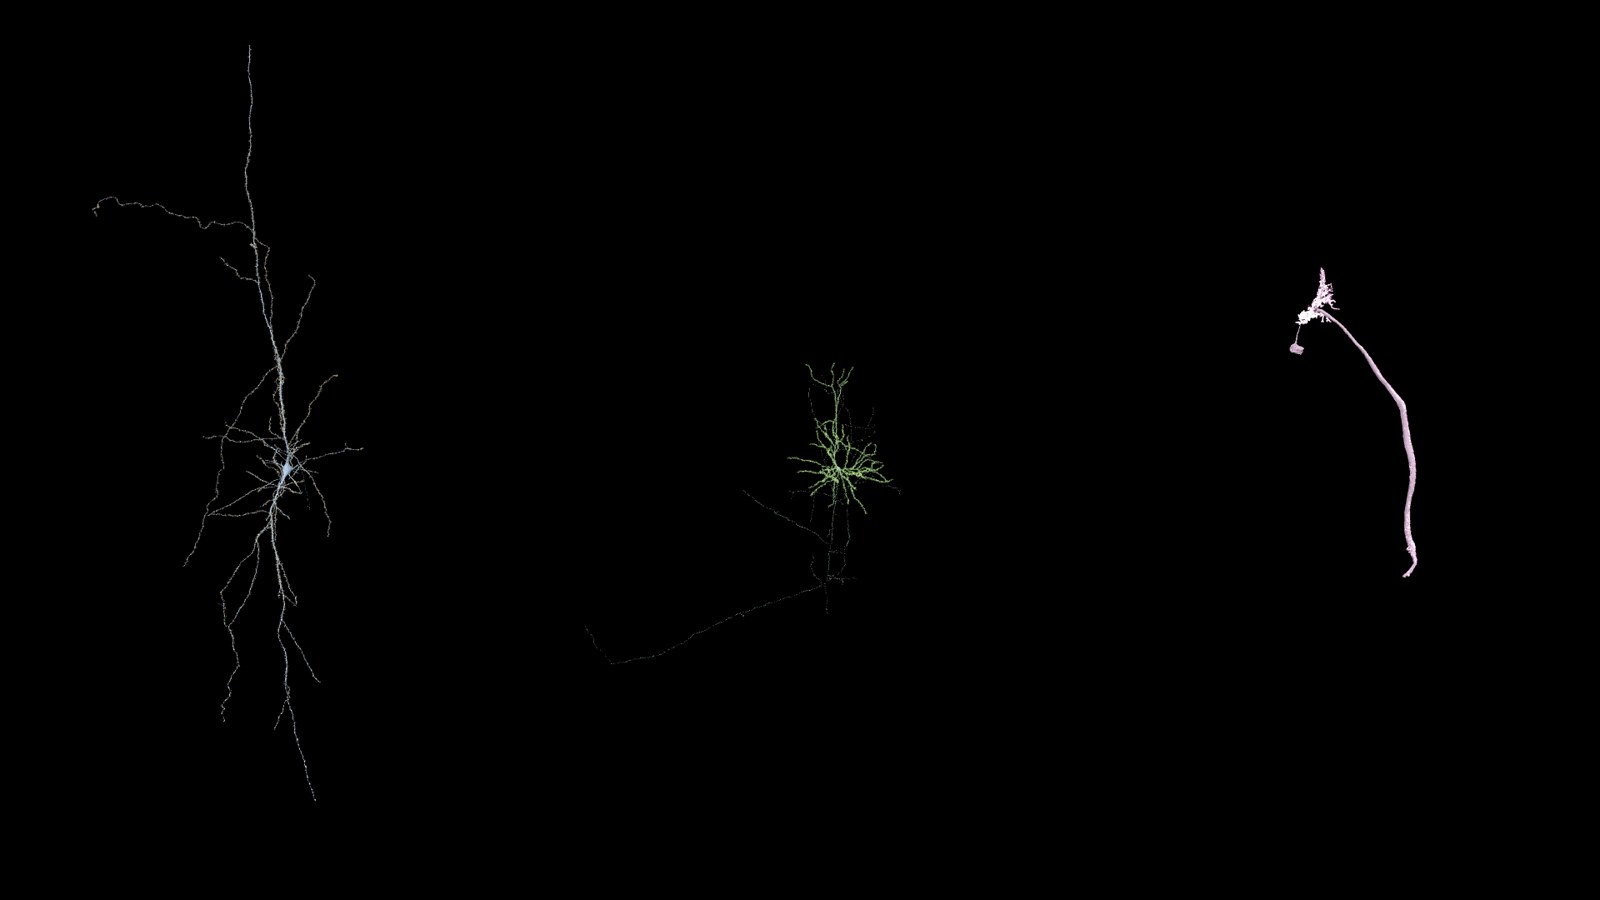 Left to right: a layer 5 pyramidal neuron from human temporal cortex (H01), a layer 2/3 pyramidal neuron from mouse visual cortex (MICrONS), and the giant fiber descending neuron of the fruit fly (Janelia male CNS). Same scale, real meshes.
The question
A human brain is enormously larger than a fruit fly's; the outline of the male fly's brain that we measured for this project is about 0.73 mm across. It is tempting to assume that a bigger brain is built from bigger, busier, better-connected cells. Electron-microscopy connectomes from three species are now public, so we asked a simple question and answered it only with numbers we measured from the public data or quoted from the original papers: if you line up neurons from each, who wins?
The three maps
| Human | Mouse | Fly | |
|---|---|---|---|
| Dataset | H01 | MICrONS (minnie65, v1300) | Janelia FlyEM male CNS v1.0 |
| Tissue | a 170 µm thick slab of temporal cortex, layer 1 to white matter (~3 mm), just over 1 mm³, removed during epilepsy surgery to reach a focus in the hippocampus beneath it | ~1 mm³ of visual cortex | the entire central nervous system |
| Source | Shapson-Coe et al., Science 2024 | MICrONS Consortium, Nature 2025 | Berg et al., Cell 2026 |
| Licence | CC BY 4.0 | CC BY 4.0 | CC BY (per the release) |
All three can be read without logging in. For MICrONS we read the synapse table directly from the public Delta Lake export (one Parquet file per range of postsynaptic IDs), so a single neuron's inputs download in a few seconds. The CAVE interface needs an account, so we did not use it.
Round 1 · Crowding: neurons per cubic millimetre
- Human, about 16,000. The H01 paper states it directly: "the density of neurons was ~16,000/mm³", with 16,087 neurons and 32,315 glia counted. The volume runs from layer 1 down into the white matter (12,482 of the 46,637 cells in H01's published cell labels carry a white-matter tag), so gray-matter density is higher.
- Mouse, about 120,000. From the MICrONS project page: roughly 120,000 neurons in a 1.4 × 0.87 × 0.84 mm volume (the whole volume, i.e. minnie65, which we used, plus the adjacent minnie35). (The paper gives the in-vivo dimensions as 1.3 × 0.87 × 0.82 mm.) As a cross-check we counted classified neurons in the best-annotated 100 µm columns of the cell table and got about 185,000 per mm³. That figure covers gray matter only, and it is a lower bound because 17% of nuclei in those columns were unclassified, so it measures something different from the official number. The video uses the official one. The H01 paper itself notes that its human density is "nearly 10-fold lower than in association cortex of the mouse".
- Fly, about 3.5 million. The male CNS has 166,700 neurons. We measured the volume of the release's brain and nerve-cord outline meshes ourselves (0.032 + 0.016 = 0.048 mm³) by summing signed tetrahedra. 166,700 ÷ 0.048 ≈ 3.5 million. The whole fly nervous system would fit into a 1 mm cube about 20 times. We checked that these outlines include the cell-body layer: of 200 randomly drawn soma points from the release, 98.5% of brain somata and 100% of nerve-cord somata fell inside the outline meshes (and 0% inside the nerve-cord neuropil mesh). So the density is not inflated by leaving the cell-body rind out.
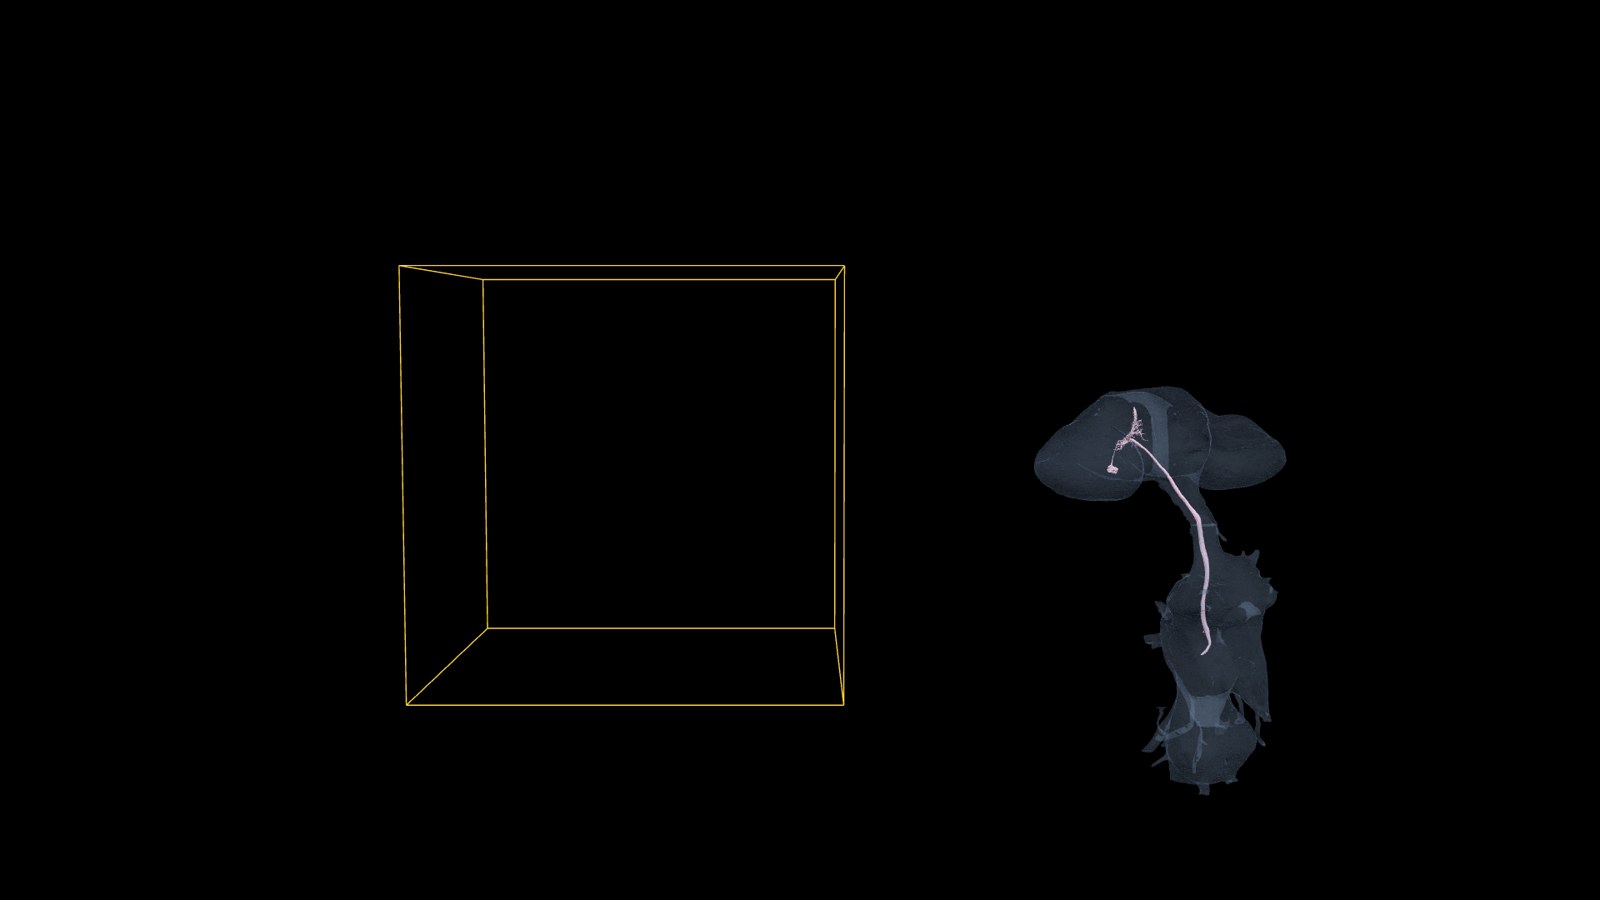 The male fly's brain and nerve cord (outline meshes from the Male CNS release) beside a 1 mm cube. The pink line is the giant fiber neuron.
Round 2 · Listening: input synapses per neuron
We counted every synapse whose postsynaptic side lands on the cell.
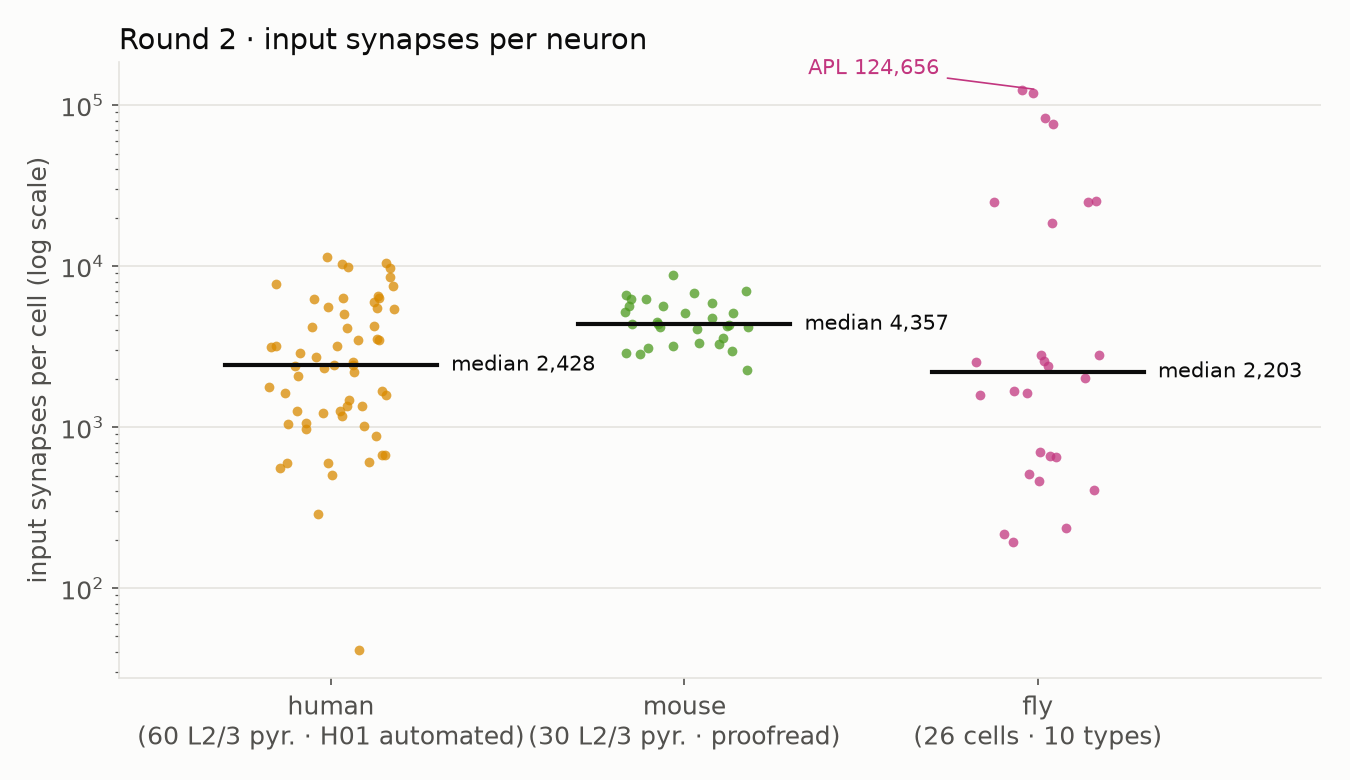
- Human: 60 layer 2/3 pyramidal cells drawn at random from the 4,156 that carry both a layer 2 or 3 tag and a "pyramidal" tag in H01's cell labels. Median 2,428 (range 41–11,413). H01 is mostly an automated reconstruction, and cells broken into pieces lose synapses, so this is an undercount. The very low values (two cells under 500) are fragmentary reconstructions.
- Mouse: 30 layer 2/3 pyramidal cells marked as proofread in the cell table (the first 30 of 526 such cells in table order; we inferred the meaning of the two proofreading columns from their values). Median 4,357.
- Fly: 26 cells from 10 chosen types (giant fiber, LPLC2, LC4, Kenyon cells, Mi1, T4a and others), up to the first three bodies of each type in table order. Median 2,203. Not a random sample: across all 166,529 male-CNS neurons with inputs the median is 364, so the types we chose sit on the busy side.
No point this round. After the video's first version we checked the human number against the literature. Published estimates for human layer 2/3 pyramidal cells are about 30,000 excitatory synapses per cell (Eyal et al. 2018), more than ten times our H01 median. H01 is a ~170 µm slab, so most of each cell's dendrites are cut off, and automated tracing loses more. Our 2,428 is not a fair stand-in for a human cell, so we no longer award this round to the mouse.
The record belongs to the fly. The two APL neurons, which innervate the mushroom bodies broadly (Liu & Davis 2009), receive 118,348 and 124,656 inputs.
Round 3 · Size
We took the widest extent of each mesh (the largest spread of its vertices along 64 evenly spaced directions).
- Human: 1,527 µm. This is a single layer 5 cell, the one shown in the video, from the automated reconstruction, so a merge error could inflate it.
- Mouse: 1,113 µm, the largest of five proofread cells we measured (four layer 5 extratelencephalic cells and one layer 2/3 cell). The cell on screen in the video is a different, smaller one.
- Fly: 633 µm, the giant fiber (DNp01 in the descending-neuron nomenclature of Namiki et al. 2018).
Human and mouse cells extend beyond their volumes, so their true size is larger. The fly cell is complete. In the dataset's coordinates the brain and nerve cord together span about 1.0 mm from top to bottom (z ≈ 79–1,077 µm), and the giant fiber runs from z ≈ 125 to 735 µm, from the brain down into the nerve cord. That is about 61% of the nervous system's length.
Round 4 · The cell body
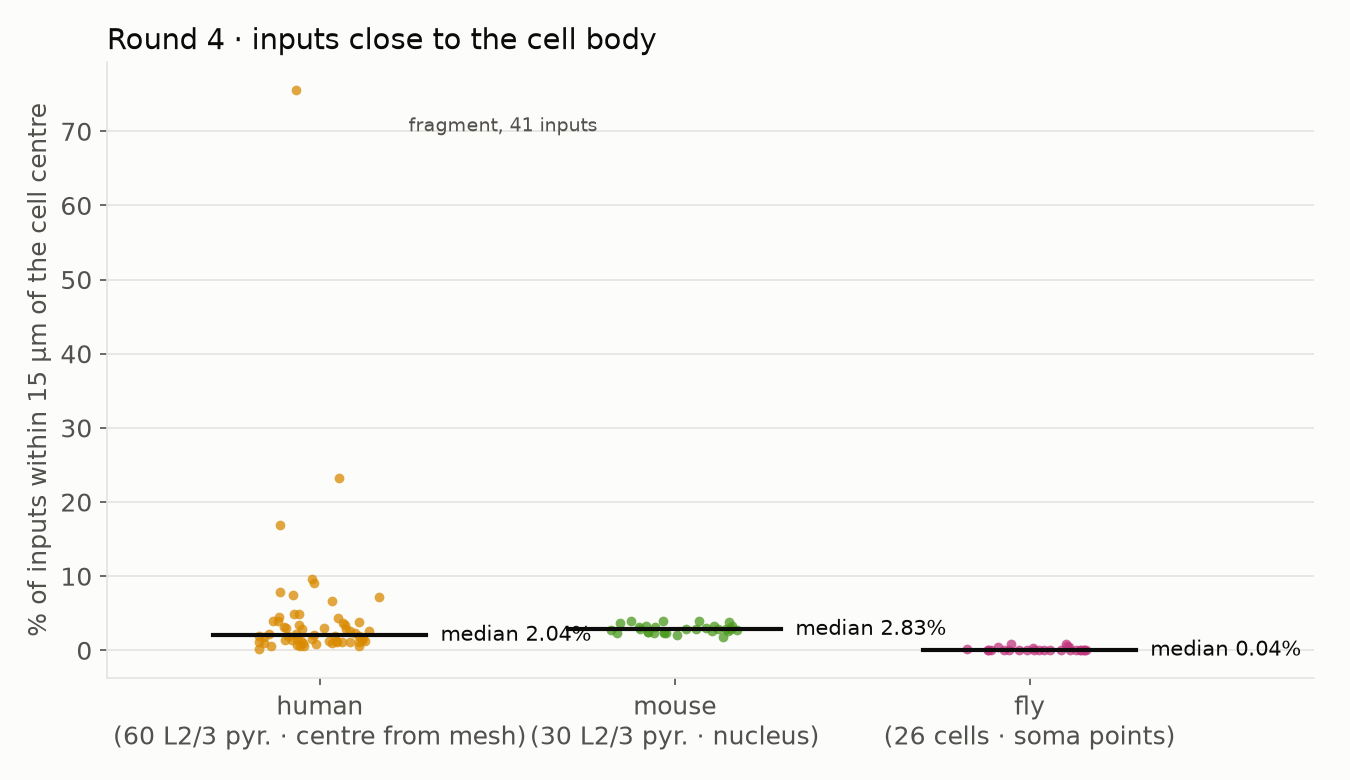
In H01, very few synapses sit on the cell body itself: 0.394% of the 133.7 million synapses whose postsynaptic partner was analysed. So we counted a wider zone: every input within 15 µm of the cell's centre, which includes the first stretch of the dendrites.
- Human: the same 60 layer 2/3 pyramidal cells, 3,769 of 208,273 inputs, 1.8% (per-cell median 2.0%). Cell centres were estimated from the mesh: find the densest 10 µm block of vertices, then refine with a 15 µm mean-shift. One fragment with only 41 inputs shows 76% (the outlier in the chart below); dropping it changes the pooled figure from 1.81% to 1.80%.
- Mouse: 30 cells, 3,938 of 140,746 inputs, 2.8% (per-cell median 2.8%). Centre = nucleus position from the cell table.
- Fly: 26 cells, 142 of 519,602 inputs, 0.03%. Centre = the soma points published with the release.
The fly result is consistent with fly anatomy. In the adult fly brain, neuronal cell bodies form a rind near the surface and are not part of the synaptic neuropil inside it (Robinson et al. 2025, a review citing Pereanu et al. 2010). Two caveats: the human and mouse centres were found by different methods, and a fixed 15 µm radius means something different for cells of very different sizes. So the mouse leads, but only narrowly.
Round 5 · The strongest single connection
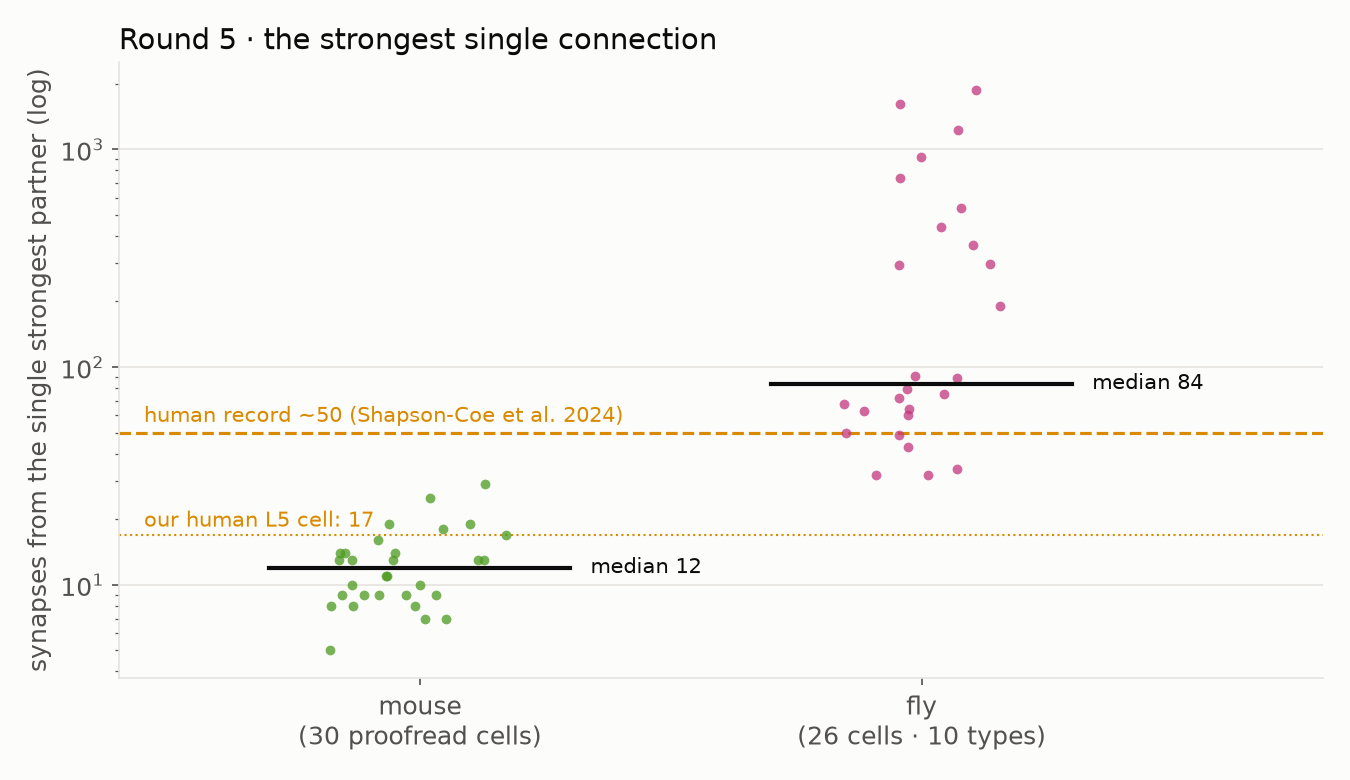
For each cell we grouped inputs by presynaptic ID and took the largest group.
- Human: the H01 abstract reports "rare powerful axonal inputs of up to 50 synapses" (the accepted manuscript says "~50"). In the main text, one example is an excitatory axon that made 53 synapses onto a nearby inhibitory interneuron (Fig. 7E). Our layer 5 cell's strongest partner gives 17, counted in the automated reconstruction, where axons are often split, so this is likely an undercount.
- Mouse: largest in our 30 cells, 29; median 12.
- Fly: 1,878, from a single neuron called DPM onto APL. The other APL's strongest partner is the other DPM neuron, with 1,611. Median across the 26 fly cells: 84. This is the largest value in our sample; across the whole fly CNS, five connections are stronger, the largest with 2,591 synapses.
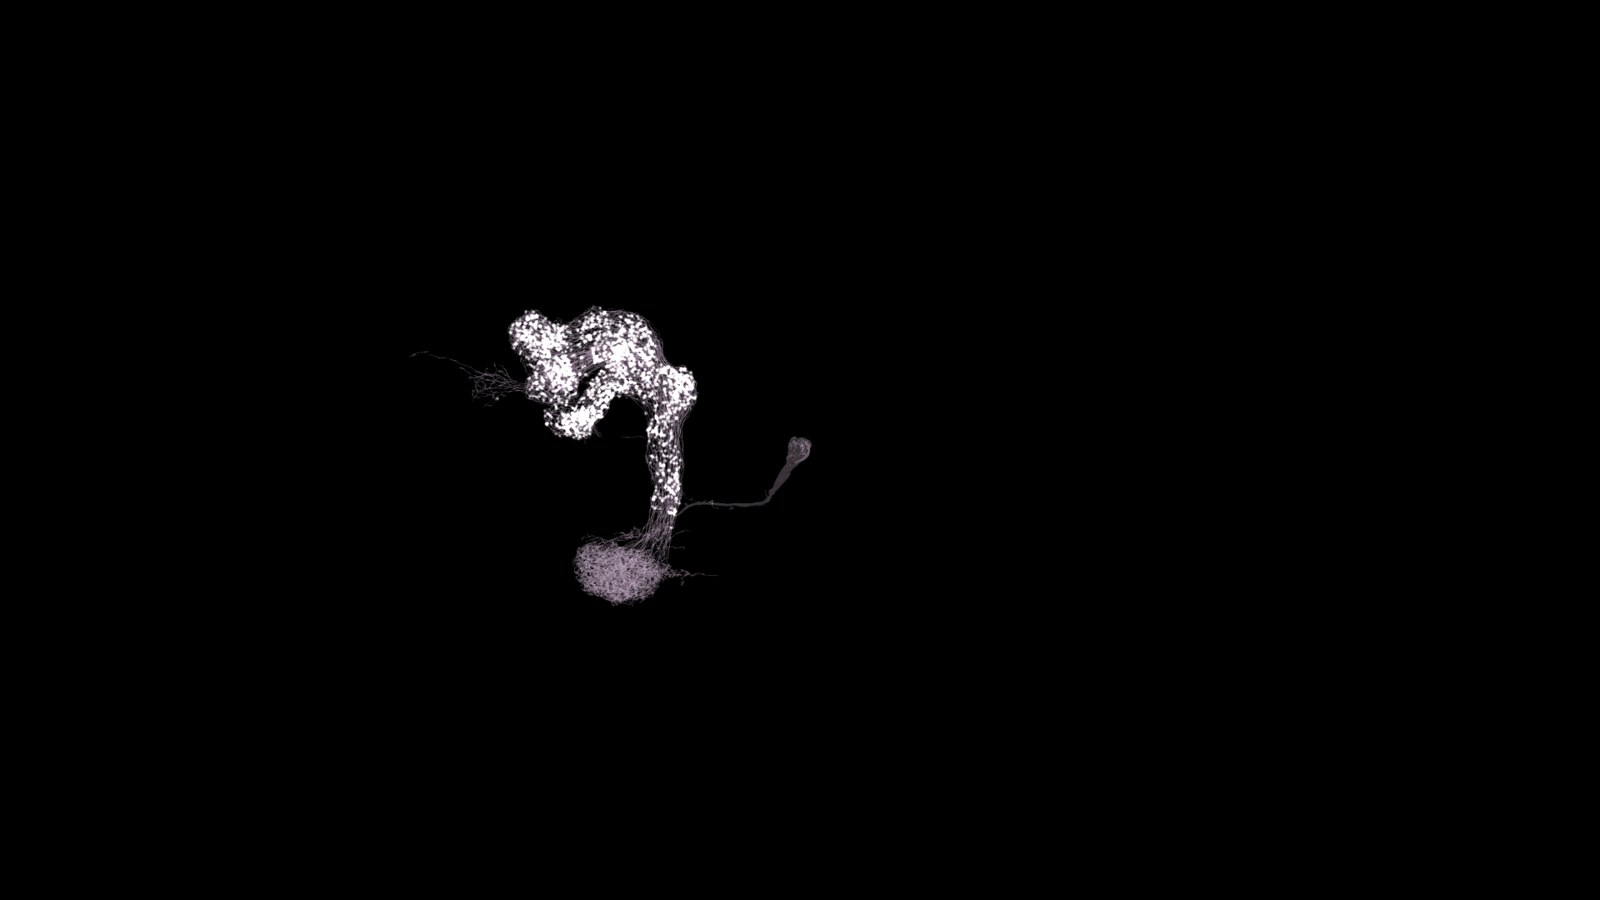 White dots: the 1,878 synapses from DPM onto one APL neuron. The rest of APL's inputs are hidden.
Final score: fly 2 (plus the input record), mouse 1, human 1, and one round (listening) with no winner.
What we got wrong first
We caught seven errors between the first draft and the published video. Most came from moving too fast from a number to a sentence.
- The human sample was the wrong kind of cell. For Rounds 2 and 4 we first used a group of 158 H01 cells that we described as "neighbours of the layer 5 neuron". They were actually a gallery set of layer 2 cells, 157 of them tagged as interneurons and located about 1.1–1.6 mm from that neuron. Comparing human interneurons with mouse pyramidal cells was not a like-for-like comparison. A second, adversarial check of this post caught it. We re-measured with 60 random layer 2/3 pyramidal cells, and the Round 4 winner changed from human (5.3%) to mouse.
- Our medians were wrong for even-sized samples. The code took the upper of the two middle values instead of their average. The fly input median, for example, was reported as 2,381 when it is 2,203.
- We estimated the human neuron count from the abstract. The abstract gives about 57,000 cells and says glia outnumber neurons 2 to 1, which gave us about 19,000. The main text has the counted value, 16,087, and a density of ~16,000/mm³.
- "Synapses on the cell body" was the wrong description of what we measured. Our 15 µm zone includes the first stretch of each dendrite. We renamed the round "within 15 µm of the cell's centre" and dropped a sentence that generalised from a single example cell in the paper's figure.
- We said the giant fiber "spans the fly's brain". Plotting it against the outlines showed that it runs from the brain down into the nerve cord.
- We attributed "up to 50" to the wrong part of the paper. We first wrote that it came from the uncorrected automated reconstruction. It is the abstract's summary, and the main-text example is a 53-synapse connection.
- We scored Round 2 on a number that undercounts. Our first cut gave "listening" to the mouse because H01's median (2,428) was below MICrONS's (4,357). A fact-check for a later Short found that published estimates for human layer 2/3 pyramidal cells are about 30,000. The thin H01 slab cuts cells off, so the round is now unscored.
A smaller one: in MICrONS, the "strongest partner" of several cells was the cell itself. Self-synapses (autapses) in an automated reconstruction are mostly segmentation or detection errors, so we excluded them.
How we checked ourselves
- Our cell counts against the paper. Counting H01's own published cell-type tags gave 30,278 glia and 15,567 neurons, close to the paper's 32,315 and 16,087.
- Every quoted sentence against its source. We re-read the full text of the H01, MICrONS, hemibrain, Namiki and Robinson papers, and the abstracts of the fly male-CNS paper and Liu & Davis, against the script.
- A separate adversarial pass. A second review went through the post sentence by sentence, assuming it contained errors. That pass found error 1, the median bug, and several wording overstatements, all fixed here.
- Two density numbers kept separate. For the mouse we report the official ~120,000 and explain why our gray-matter column count is higher, instead of picking whichever looked better.
Why this is not a fair fight
- Different regions and ages. Human temporal cortex from a surgical patient, mouse visual cortex, a whole fly CNS.
- Different proofreading. Mouse cells were proofread; the human cells were not; the fly CNS is fully proofread.
- Truncation. Human and mouse cells are cut at the edge of their volumes, and the human volume is a 170 µm slab. Fly cells are complete.
- Different units of "synapse". In flies, a single presynaptic release site (a T-bar) is typically contacted by several receiving neurites (Scheffer et al. 2020). We counted each postsynaptic contact, so a fly "synapse" here is not the same unit as a one-to-one mammalian synapse.
- Detection misses synapses. By proofreading a selection of axons, the H01 team estimated that 11% of excitatory and 35% of inhibitory synapses were missed. MICrONS reports 96% precision and 89% recall.
- Small, non-random samples. 60, 30 and 26 cells for the main rounds, with the mouse cells taken in table order and the fly cells chosen by type. Size and the human strongest-partner count each rest on single cells.
So the honest conclusion is narrower than the video title. In these samples the three species' neurons differ in ways that don't line up with brain size. The fly has the densest packing and by far the heaviest single connections. The mouse cells in our sample have the most inputs (median 4,357), but that does not make them the winner over human cells: the H01 slab is too thin for a fair comparison, since it cuts the human cells off, and published estimates for human layer 2/3 pyramidal cells are about 30,000. The single human cell we measured is the largest. That describes these samples, not a general law.
Data and references
- H01: Shapson-Coe A. et al. (2024) Science 384:eadk4858, doi:10.1126/science.adk4858 · gs://h01-release
- MICrONS: MICrONS Consortium (2025) Nature 640:435–447, doi:10.1038/s41586-025-08790-w · www.microns-explorer.org
- Fly male CNS: Berg S. et al. (2026) Cell 189:5504–5526, doi:10.1016/j.cell.2026.08.015 · gs://flyem-male-cns
- Liu X., Davis R.L. (2009) Nat Neurosci 12:53–59, doi:10.1038/nn.2235 (APL)
- Namiki S. et al. (2018) eLife 7:e34272, doi:10.7554/eLife.34272 (giant fiber = DNp01)
- Scheffer L.K. et al. (2020) eLife 9:e57443, doi:10.7554/eLife.57443 (polyadic synapses)
- Eyal G. et al. (2018) Front Cell Neurosci 12:181, doi:10.3389/fncel.2018.00181 (human L2/3 synapse estimate)
- Robinson et al. (2025) The Drosophila adult brain: short overview of structure, function, and resources. Curr Res Insect Sci 7:100113, doi:10.1016/j.cris.2025.100113 (cell body rind)
Measurements were made with our own scripts against the public files. Corrections are welcome. If you find an error, tell us and we will fix the post and pin a correction under the video.
More from Inside the Connectome: We followed one neuron through a map of the human brain (H01) · Why is nicotine so hard to quit? · Same lock, different effects: LSD and lisuride
Author — the operator of kbrain-map.org, a researcher who analyses multi-omics (proteomics) data. The measurements behind the Inside the Connectome videos and this methods post were made directly on the public connectome data.
A note from the operator — The video is four minutes long, so it could not show everything behind the numbers. If you find a mistake, please tell us: we will fix the post and pin a correction under the video.
관련 글
We Followed One Neuron Through a Map of the Human Brain — Methods, Numbers, and What We Got Wrong
10월 1일 · 8 min read
신경과학사람 vs 쥐 vs 파리: 뇌세포 다섯 라운드를 어떻게 쟀나 (그리고 처음에 틀린 것들)
10월 16일 · 23 min read
신경과학사람 뇌 지도에서 뉴런 하나를 따라가 봤다 — 방법, 숫자, 그리고 우리가 틀렸던 것
10월 1일 · 13 min read
NeuroscienceSame Lock, Different Effects: Why LSD Is Psychedelic and Lisuride Isn't
10월 9일 · 8 min read