We Followed One Neuron Through a Map of the Human Brain — Methods, Numbers, and What We Got Wrong
We opened the public H01 human-cortex connectome and counted every input to a single layer-5 pyramidal neuron: 6,131 synapses from 4,761 axon segments. Here are the methods, the figures, and the caveats our video could only hint at.
Companion post to our video: We followed one neuron through a map of the human brain (H01). The video is for everyone; this post is for readers who want the numbers, the methods, and the caveats.
한국어판: 사람 뇌 지도에서 뉴런 하나를 따라가 봤다
Update (October 19, 2026): the numbers below came from the older of two public H01 synapse releases. H01 publishes its c3 synapse table twice. We used
gs://h01-release/data/20210601throughout this post, and it turns out to be the raw table before duplicate merging (191.4 million synapses). The paper's final table is20210729(150.5 million; its per-cell counts match the paper's Table S14 exactly). Re-running this post's analysis on the final release:
Older release (used below) Final release Input synapses on this neuron 6,131 4,797 Inhibitory 2,119 1,256 Inputs within 20 µm of the soma that are inhibitory 126 of 129 (98%) 83 of 86 (96.5%) Sending axon segments 4,761 4,587 Segments that make exactly one synapse 81% 96.6% Share of input from segments that connect two or more times 36% 7.7% Most synapses from one segment 17 12 (still all inhibitory, still next to the soma) The main conclusions hold and one gets stronger: inputs near the cell body are almost all inhibitory, and nearly every axon contacts this neuron only once. The older release's near-duplicate synapses (pairs within 750 nm on the same contact) had inflated the apparent number of repeated connections about fivefold. We have left the original text below unchanged so the correction is visible. Code:
verify/h01-inputs.jswithH01_SYN_RELEASE=20210729.How to tell the two releases apart, and what else differs between them: Which H01 is it?
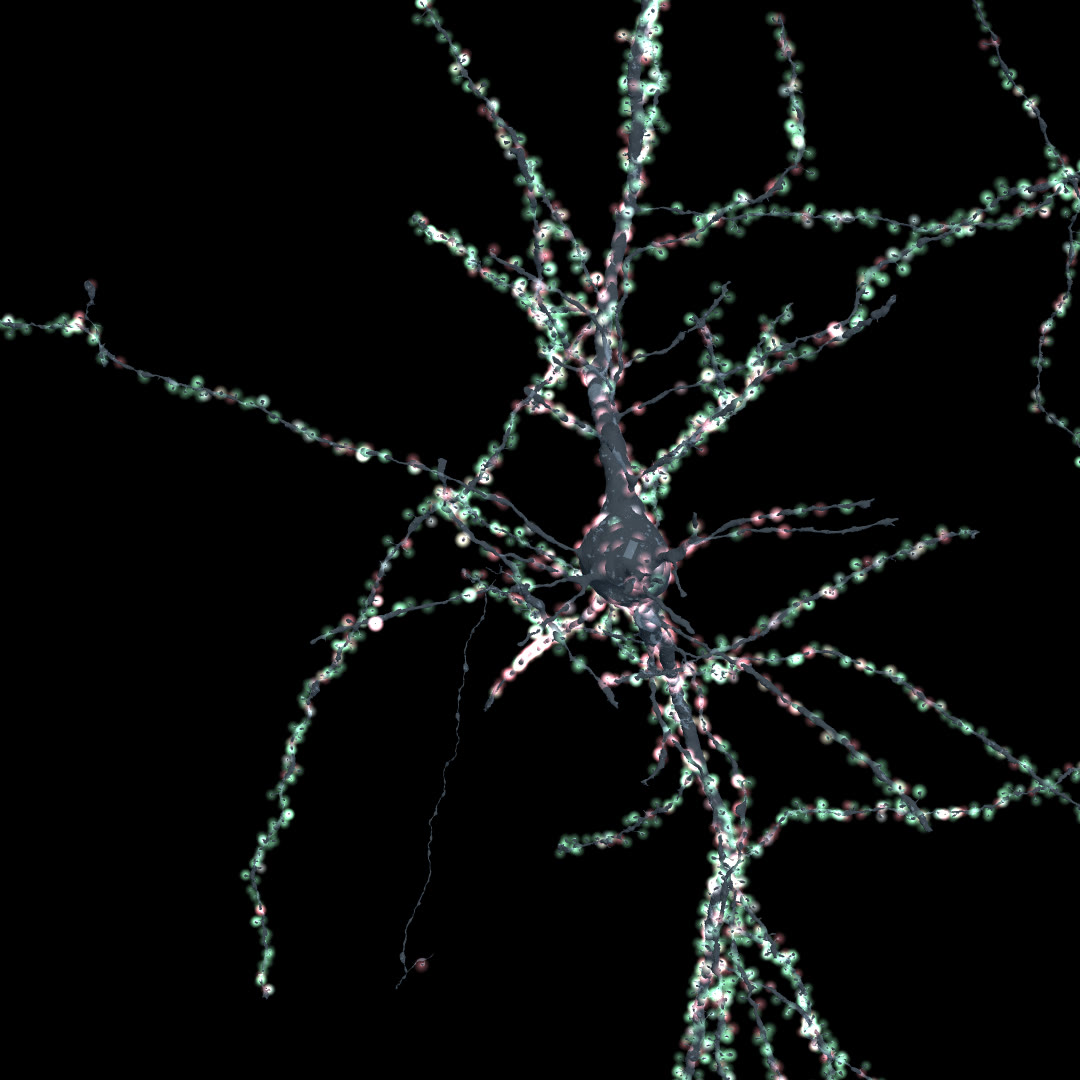 One layer-5 pyramidal neuron from H01 (cell 6644185383). Each dot is an input synapse: green = labeled excitatory, red = labeled inhibitory. Rendered from the public data (CC BY 4.0).
Why one neuron?
In 2024, a Harvard–Google team published H01, a map of about one cubic millimeter of human temporal cortex at synapse resolution: roughly 57,000 cells and 150 million synapses, from 1.4 petabytes of electron-microscope images (Shapson-Coe et al., Science 2024). The tissue was removed during surgery for drug-resistant epilepsy, on the way to a deeper focus.
The headline numbers were widely covered. What the coverage rarely does is open the data. So we picked one neuron and asked three simple questions:
- Who sends it messages, and how often does each sender connect?
- Where on the cell do the different kinds of input land?
- Which single input is the "loudest"?
The data, briefly
| Item | Value | Source |
|---|---|---|
| Sample | ~1 mm³, anterior middle temporal gyrus | paper |
| Sections | 5,019 at 33.9 nm average (0.170 mm total) | paper, main text |
| Pixel size | 4 × 4 nm | paper |
| Segmentation used | c3 (the conservative agglomeration: fewer merges, more splits) | H01 release |
| Synapses | automated detection + automated excitatory/inhibitory labels | H01 release |
| Our cell | 6644185383 — tagged L5 · pyramidal in the H01 segment properties | H01 release |
A correction to our own earlier draft: we first wrote "5,293 slices", which is the size of the volume's z-grid in 4nm_raw/info, not the number of physical sections. The paper reports 5,019.
Method
Everything below uses only the public bucket gs://h01-release (readable over plain HTTPS) and no special software.
- Inputs to the cell. The synapse annotation layer (
c3/synapses/precomputed) has apost_synaptic_cellindex. Looking up our cell returns 6,131 synapses with their positions and E/I labels (4,012 excitatory, 2,119 inhibitory). - Who sent each one. That index does not carry the sender, so we opened each synapse by ID (
by_id) and read itspre_synaptic_cellrelationship. 66 synapses have no presynaptic segment assigned; the remaining 6,065 come from 4,761 distinct axon segments. - Where each one lands. We re-estimated the cell-body center with a 15 µm mean-shift on the neuron's own mesh, then measured each synapse's straight-line distance from it.
The reader is about 150 lines of JavaScript (sharded precomputed format, MurmurHash3, gzip). A step-by-step Python version is coming as a separate tutorial.
Finding 1 — Most inputs whisper, a few shout
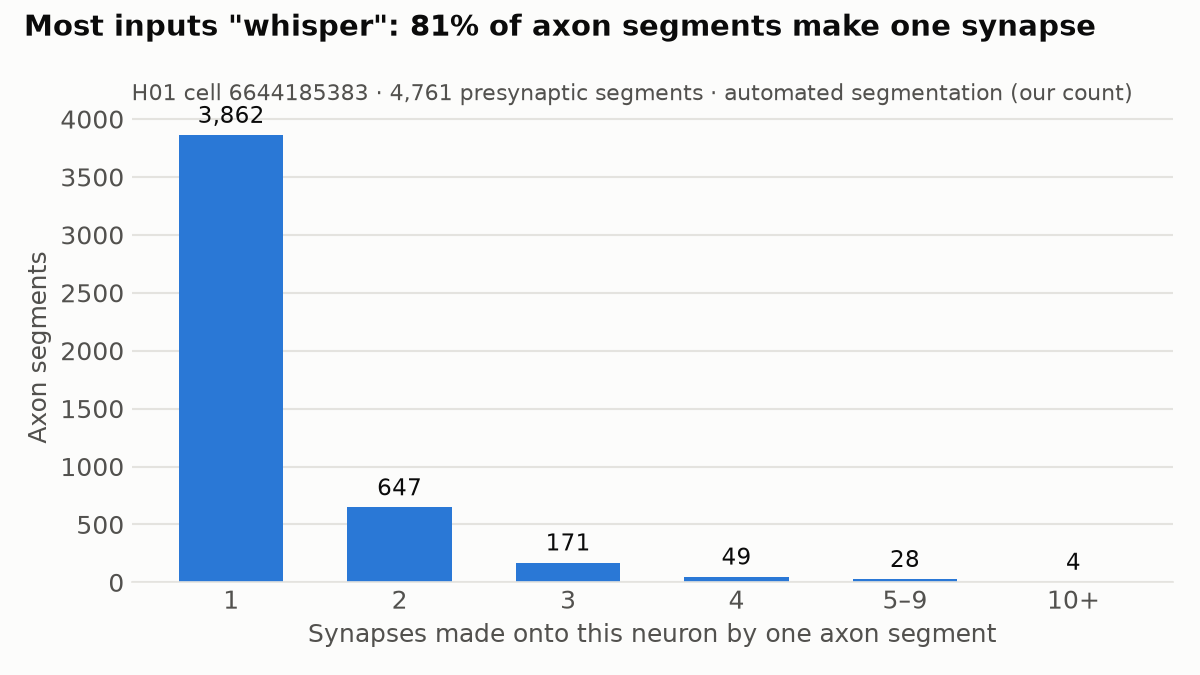
- 81% of axon segments (3,862 of 4,761) make exactly one synapse on this cell.
- But segments that connect two or more times supply 36% of its input (2,203 of 6,065 synapses).
- Only 4 segments make 10 or more.
This matches the paper's picture of "thousands of weak connections" with rare strong ones (the paper reports single axons making up to ~50 synapses onto one cell, elsewhere in the volume).
Caveat that points one way. The c3 segmentation splits axons more often than it merges them. When one real axon is cut into pieces, a repeat connection gets counted as several single ones. So 81% is probably an overestimate, and 36% an underestimate.
Finding 2 — The cell body is ringed by inhibition
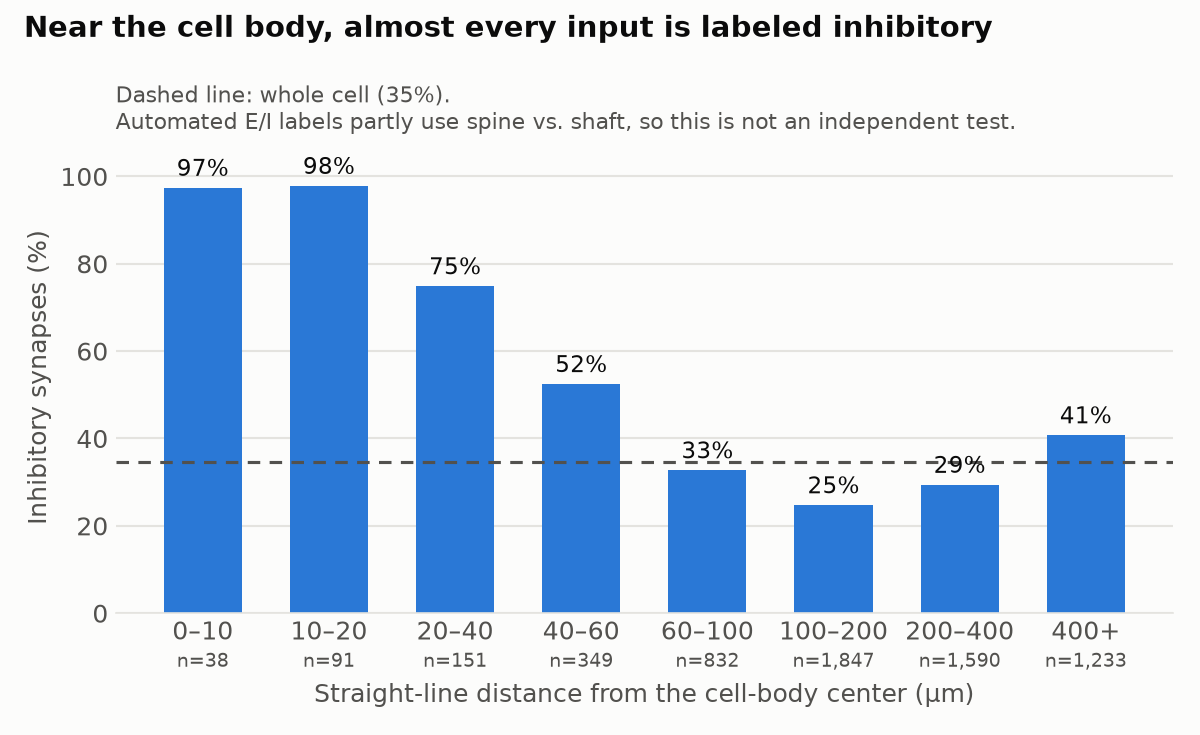
- Across the whole cell, 35% of inputs are labeled inhibitory.
- Within 20 µm of the cell-body center, 126 of 129 (98%) are.
- The share falls to about a quarter at 100–200 µm, then rises again past 400 µm, out on the distal dendrites.
This is the textbook picture of perisomatic inhibition: inhibitory interneurons target the cell body, close to where the neuron decides whether to fire (strictly, the axon initial segment next to it).
Caveat that matters most. According to the paper, the automated E/I classifier uses the look of each synapse and whether it sits on a dendritic spine. The cell body has no spines. So part of this 98% may come from how the labels are made. Our result is consistent with the textbook, but it is not an independent test of it. Overall, the paper reports that the classifier labels excitatory synapses correctly 86.9% of the time and inhibitory ones 85.0%. For detection itself, it reports false-discovery rates of 3.2% (excitatory) and 2.7% (inhibitory), and that detection misses about 35% of inhibitory synapses (11% of excitatory) — which pushes the other way.
Finding 3 — The loudest voice we could find
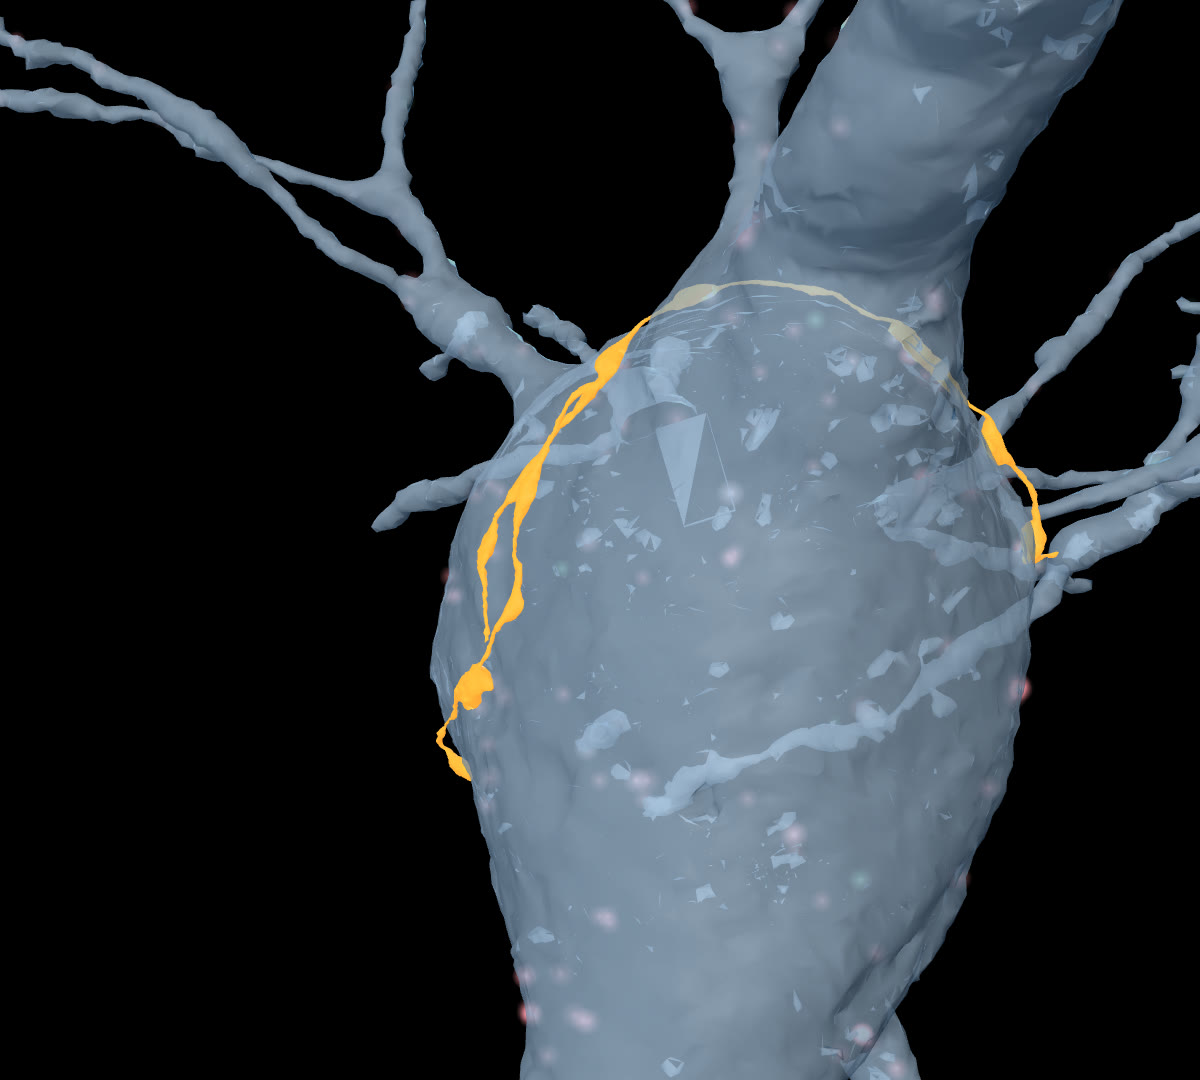 Orange: axon segment 15684336582. All 17 of its synapses onto our neuron lie on the cell body.
The segment with the most synapses onto our neuron makes 17, every one labeled inhibitory, all 8.6–10.2 µm from the cell-body center, i.e. on the soma surface. In 3D it arcs over the cell body like a hand on a brake.
In the whole dataset, this segment has no other output synapses. That sounds remarkable, but it is almost certainly a property of the fragment, not the cell: the rest of the axon was not traced into this segment. Perisomatic inhibitory axons (basket-cell-like) usually contact many cells.
Two more checks we ran on the "top" list:
- The second-ranked segment (11 synapses) has 640 outputs with both labels mixed. It is very likely a merge error, and we left it out of the story.
- 153 segments carry both E and I labels (433 synapses). A real axon should be one or the other. We kept them in the counts; excluding them gives 84% single-synapse segments and 31% of input from repeat segments. The conclusions do not change.
What we got wrong on the way (and fixed)
An outside review of our script caught several things before the video went out. In the spirit of our Methodology page, here they are:
| First draft | Fixed version | Why |
|---|---|---|
| "5,293 slices" | 5,019 sections | grid size ≠ section count |
| "This neuron receives about 6,000 messages" | "In this map, we can see about 6,000…" | the volume cuts off most dendrites; 6,131 is a lower bound |
| "4,700 axons" | ~4,800 axon segments | mixed two sources; segments ≠ axons |
| "It makes no synapses anywhere else" | "It's only a fragment" | fragment, not biology |
| "where the neuron decides whether to fire" | "right next to where…" | firing starts at the axon initial segment |
| The "up to 50" scene implied the pair on screen | pair on screen makes 8 (our count) | the paper's ~50 refers to other pairs |
| "98% inhibitory" as a finding | "consistent with, not a test of" | classifier uses spine vs. shaft |
Limits, in one place
- One neuron, from one person with epilepsy. It may not look like every brain.
- Automated segmentation (c3), not proofread: split axons, a few merges.
- Automated synapse detection and E/I labels: 86.9% / 85.0% correctly classified (excitatory / inhibitory), false discovery 3.2% / 2.7%, missed 11% / 35% (paper).
- Straight-line distances, not path length along the dendrite.
- The H01 segment-property table lists different E/I totals for this cell (2,947 / 2,056) than the synapse annotations we used (4,012 / 2,119). We report the annotation counts and note the gap.
Next
The video promised the same questions in a mouse brain that was recorded while it watched videos (MICrONS). That dataset includes proofread neurons and recorded activity, so it can check some of the caveats above. That is the next deep dive.
References
- Shapson-Coe A. et al. (2024). A petavoxel fragment of human cerebral cortex reconstructed at nanoscale resolution. Science 384: eadk4858. doi:10.1126/science.adk4858
- H01 data release,
gs://h01-release/data/20210601— CC BY 4.0
Data: H01 release (CC BY 4.0). Counts, figures, and renders in this post are our own exploratory analysis of the public data. Not medical advice.
관련 글
Which H01 Is It? Two Public Synapse Releases, Only One Matches the Paper — and How We Found Out the Hard Way
10월 19일 · 8 min read
NeuroscienceHuman vs Mouse vs Fly: How We Measured Five Rounds of Brain-Cell Comparisons (and What We Got Wrong First)
10월 16일 · 15 min read
NeuroscienceWhy Do Some Allergy Pills Make You Sleepy? Eight Histamine Neurons, One Receptor Pocket, and a Door
10월 20일 · 11 min read
NeuroscienceWhy Is Nicotine So Hard to Quit? What the Real Receptor Structures Show
10월 3일 · 6 min read