What Fraction of Neurons Are Inhibitory in the Human Cortex? About 31% in Our Count (vs 12% in Mouse)
In about one cubic millimetre of human cortex (H01), 4,688 of 15,219 classified neurons are inhibitory interneurons: 31%. In a mouse cortex map (MICrONS) we count 12%. How we counted, how it changes by layer, and what the number does not tell you.
This is the companion post to our Short Almost 1 in 3 neurons here is a brake. The number is also on our Numbers page, with the method and the caveats in one card.
The short answer
In one piece of human cortex, about one cubic millimetre, 31% of the neurons are inhibitory. The exact count is 4,688 interneurons out of 15,219 neurons that the dataset gives a type. That is almost one neuron in three.
Inhibitory neurons are the cells that slow other neurons down. Most of the rest are excitatory: pyramidal cells and their spiny relatives, which push their targets to fire.
When we ran the same count on a public map of mouse visual cortex, we got 12%. The two maps differ in species, brain area and method, so read that comparison with care (more below).
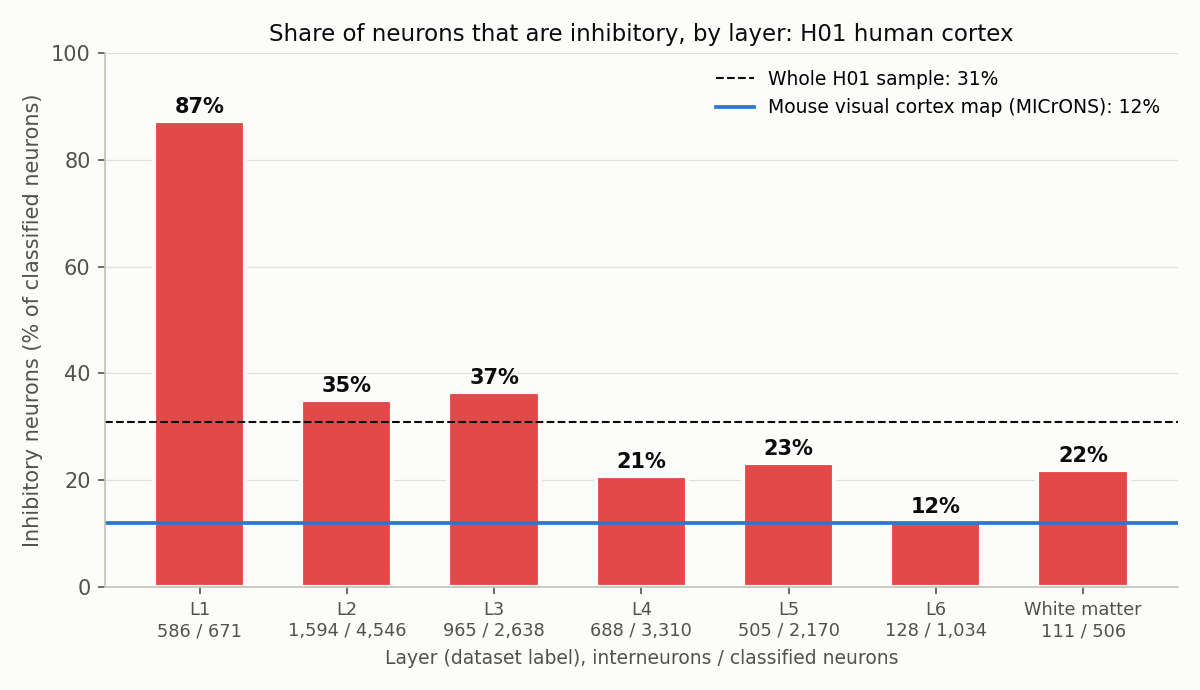
Share of classified neurons labelled as interneurons in each layer. Under each bar: interneurons / classified neurons. Our count from H01 somas.csv (dataset's own labels). Mouse line: our count of the MICrONS cell table.
The map we used
H01 is a fragment of human temporal cortex removed during epilepsy surgery, imaged with an electron microscope at nanometre resolution and reconstructed in 3D (Shapson-Coe et al. 2024, Science). It is about one cubic millimetre and is public under CC BY 4.0.
The release includes a table, somas.csv, with one row per cell body: its position, its cell type and its cortical layer. The H01 team classified the cells by hand from their appearance in the images and their 3D shape. The neuron labels are:
- Pyramidal: 8,803
- Spiny atypical: 1,535
- Spiny stellate: 193
- Interneuron: 4,688
- Unclassified neuron: 868
These match the totals in the paper's Table S5, which also reports the same split: 0.692 excitatory and 0.308 inhibitory.
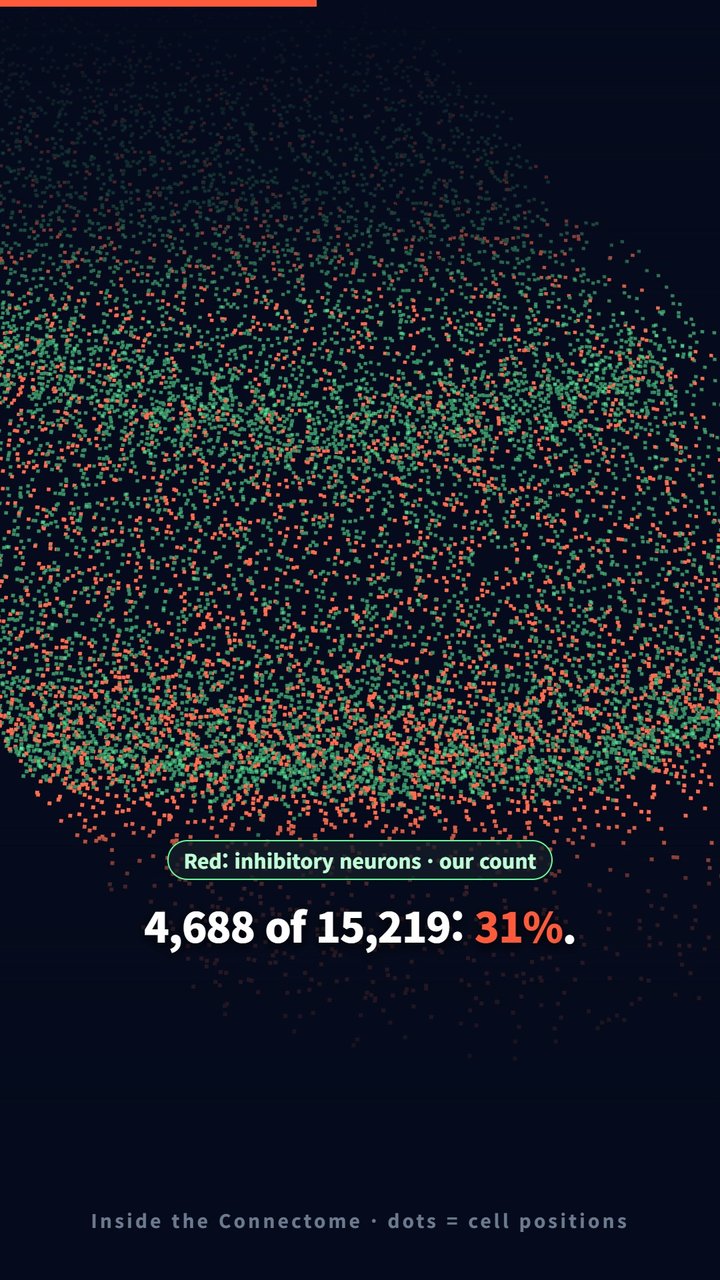
Frame from our Short. Each dot marks a cell-body position, not a cell's shape. Green: excitatory neurons. Red: inhibitory neurons.
How we counted
- Inhibitory = cells labelled
INTERNEURON(4,688). - Classified neurons = pyramidal + spiny atypical + spiny stellate + interneuron (15,219). We left out the 868 "unclassified neurons", because we cannot tell which side they belong to. If you put them in the denominator, the share drops to 29.1%. Either way it is close to one in three.
- By layer we used the dataset's own layer label for each cell body. 344 classified neurons have no layer label, so the layer bars add up to 14,875 neurons, not 15,219.
It is not one in three everywhere
The share changes a lot with depth:
- Layer 1, the top layer, is almost all inhibitory: 586 of 671 classified neurons (87%). Layer 1 has few neurons of any kind; we wrote about that in What is in layer 1 of the human cortex?. The paper's own density table (Table S6) lists no spiny (excitatory) neurons in layer 1 at all, so the 72 pyramidal cells our count finds there may be a matter of where the layer border is drawn.
- Layers 2 and 3: 35% and 37%.
- Layers 4 and 5: 21% and 23%.
- Layer 6: 12%, about the same as the whole mouse map.
So "31%" is an average over a sample that is rich in upper layers. A sample with more deep cortex would give a lower number.
How this compares with mouse
For mouse, we used the cell table of the MICrONS map, about one cubic millimetre of mouse visual cortex (MICrONS Consortium 2025, Nature). Its coarse labels give 9,017 inhibitory and 66,388 excitatory neurons: 9,017 of 75,405, or 12.0%.
Our human share is about 2.6 times the mouse share. A study that compared mouse and human cortex directly with connectomics, Loomba et al. (2022, Science), reports a "2.5-fold increase in interneurons in humans compared with mice". Their abstract adds a twist: the extra interneurons did not give human pyramidal cells a matching increase in inhibitory input. Instead, the increase "created an expanded interneuron-to-interneuron network". In plain words: many of the extra brakes act on other brakes.
We do not treat our 2.6 as a measurement of that same thing. The two maps are:
- different brain areas: human temporal cortex versus mouse visual cortex;
- classified by different methods: hand labels in H01; in MICrONS, mostly labels from automated classifiers (the table names the model behind each label);
- different in layer coverage, and the share depends strongly on layer (see above).
The direction agrees with Loomba and colleagues. The exact ratio should not be quoted as a species difference.
For a wider comparison of these maps, see Human vs mouse vs fly: how we measured five rounds of comparisons.
What this number does not tell you
- One sample. One person, one area of temporal cortex, removed during epilepsy surgery. Whether it is typical of healthy cortex is an open question the H01 authors raise themselves.
- Labels, not physiology. "Interneuron" here is the dataset's label from cell shape in electron microscope images. Nobody recorded these cells firing or tested which transmitter they release.
- Cell bodies, not synapses. A 31% share of cell bodies does not mean 31% of synapses are inhibitory. Each type makes different numbers of synapses. If you want synapse-level counts, our one-neuron methods post follows every input to one pyramidal cell.
- No subtypes. The table does not split interneurons into the families biologists usually name, so we cannot say which kinds make up the extra share.
Code and data
- Cell types and layers: H01
somas.csv, columnscelltypeandlayer. - Mouse: MICrONS
aibs_cell_infotable, coarse excitatory/inhibitory column. - The counts and the bar chart come from one re-runnable Python script.
References
- Shapson-Coe A, Januszewski M, Berger DR, et al. A petavoxel fragment of human cerebral cortex reconstructed at nanoscale resolution. Science. 2024;384:eadk4858. doi:10.1126/science.adk4858
- MICrONS Consortium. Functional connectomics spanning multiple areas of mouse visual cortex. Nature. 2025;640:435–447. doi:10.1038/s41586-025-08790-w
- Loomba S, Straehle J, Gangadharan V, et al. Connectomic comparison of mouse and human cortex. Science. 2022;377:eabo0924. doi:10.1126/science.abo0924
Related
What Is in Layer 1 of the Human Cortex? Few Neurons, Many Astrocytes
Nov 2 · 6 min read
NeuroscienceHuman vs Mouse vs Fly: How We Measured Five Rounds of Brain-Cell Comparisons (and What We Got Wrong First)
Oct 16 · 15 min read
NeuroscienceWhat Is the Most Common Cell in the Human Brain? In This Sample, Not the Neuron
Nov 2 · 6 min read
NeuroscienceWhy Is White Matter White? 31.5% of Its Mapped Volume Is Myelinated Axons
Nov 2 · 7 min read